Change-of-Direction Validation: Field Radar vs. 10-Camera Motion Capture

Can one device accurately measure change of direction performance, without any wearables, gates, wires, jackets, calibration...?
We decided to find out (again...). We took our Ledsreact Pro into the University of Ghent's biomechanics laboratory, stood it next to a gold standard 10-camera Qualisys motion capture system, and ran 33 change-of-direction trials.
The answer: total COD time matched to within a millisecond. Concordance correlation coefficient: 0.991. Velocity and acceleration tracked with very strong agreement. There was one systematic difference of a 97ms faster return split, which we can explain with basic geometry.
Let's dive into it!
Background
We already validated the Ledsreact Pro against Qualisys in 2023 (@ TU Dortmund, see results here). The hardware and core algorithms worked. But between that study and this one, we improved the embedded software and post-processing for better fault tolerance.
The reason why? Our device's main strength is simultaneously one of its weaknesses compared to traditional measurement tech such as timing gates: its simplicity. With timing gates you can physically see the splits your athletes have to cross. You can generally see or hear when something goes wrong (such as a gate being knocked over, or someone walking through a gate). With the first versions of the Ledsreact Pro however, the radar could fail silently, leaving the coach wondering what went wrong.
Device angled wrong horizontally or vertically? Player ran at an angle? Another player entered the detection zone? All common failure reasons due to radar's invisibility. So we are adding better user feedback mechanisms, but before we deploy our changes, we had to prove we didn't break measurement accuracy while making the system more forgiving.
Spoiler alert: it didn't!
Ground Truth: The Qualisys Setup
To ground-truth our measurements, we partnered with the University of Ghent for use of their biomechanics lab outfitted with a gold-standard 10-camera Qualisys 3D motion capture system.
Their facility, time, expertise, and collaborative spirit made this validation possible, so we would like to thank them sincerely.

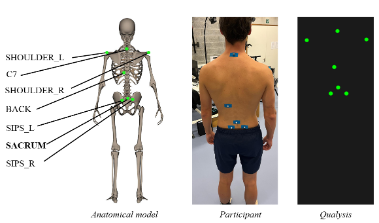
The UGent team set up a controlled indoor environment with 10 Oqus cameras running at 250 Hz. This system operates using infrared cameras that detect reflective markers attached to specific anatomical landmarks. The camera emits an infrared signal, which is reflected by the marker and subsequently detected by the camera sensor. In this way, the spatial position and movement of the reflective marker can be tracked with high accuracy.
Measurement zones extended 50 cm before and after key landmarks to ensure we captured the entire movement.
For tracking, they placed seven reflective markers on each athlete:
- the right and left shoulders
- the seventh cervical vertebra (C7)
- the lower-back
- the sacrum
- the right and left superior iliac spines
Test Protocols
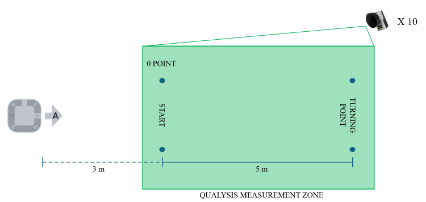
5-5 COD Test (Neutral Start)
Athletes started from a standing, neutral position, sprinted 5 m outbound, turned 180°, returned 5 m to the start.
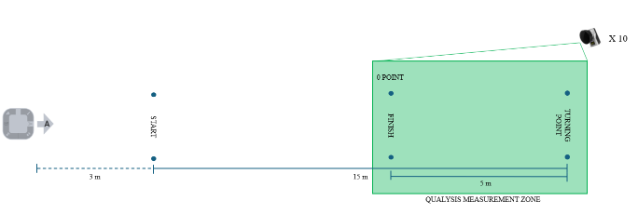
5-0-5 Agility Test (15-5 COD)
Next, we moved the Ledsreact Pro back in order to capture and run the canonical 5-0-5 agility test after Draper & Lancaster, 1985.
Athletes start again from a standing, neutral position, sprint 15 m outbound, turned 180°, returned 5 m to the start. Only the last 5 m is captured by the Qualisys system, while the Ledsreact Pro captures the full trajectory.
Qualisys Filtering
The trajectory of the sacrum marker was used to represent displacement of the body's center of mass (Napier et al., 2020).
The sacrum marker was positioned relative to the two markers placed at the starting line (5–5 COD) or finish line (15–5 COD). When the sacrum marker was not visible, its position was set to zero. Position data were filtered using a 1Hz fourth-order low pass Butterworth filter (similar to the study by Ken-Ich et al., 2019).
Velocity and acceleration were derived from the position data by computing the first and second derivatives, respectively.
Ledsreact Pro
The Ledsreact Pro measures the athlete's distance, angle, and velocity directly through the Doppler effect and a 24GHz pulsed FSK radar collecting many raw data samples in 29ms frames. The start signal is given after a 3 second countdown. The finish is detected in real-time.
After each bout, the data is immediately uploaded and post-processed: a Kalman filter is used to calculate position, velocity, and acceleration over time. Results are available within seconds after every finish.
We used the default settings of our device, which result in a smoothened acceleration curve. The investigation of more sensitive Kalman parameters to extract instantaneous acceleration (the micro-accelerations that come with every step) compared with a higher Butterworth filter cut-off frequency applied to the Qualisys data, is reserved for a follow-up study...
Results
Total Time
Qualisys: 3.171 ± 0.320 s | Pro: 3.170 ± 0.310 s
- Bias: −0.00083 s
- MAE: 0.0338 s | RMSE: 0.0411 s
- 95% LoA: ±0.082 s
- Pearson r: 0.992 | CCC: 0.991
Conclusion: total COD time is interchangeable between systems. The concordance is near-perfect. If you're using Ledsreact Pro to track return-to-play timelines or talent identification benchmarks, you're getting laboratory-grade timing accuracy.
Split Times
Here's where the story gets interesting. The outbound split (0–5m) showed excellent agreement. The return split (5–0m) was consistently 97 ms faster on radar.
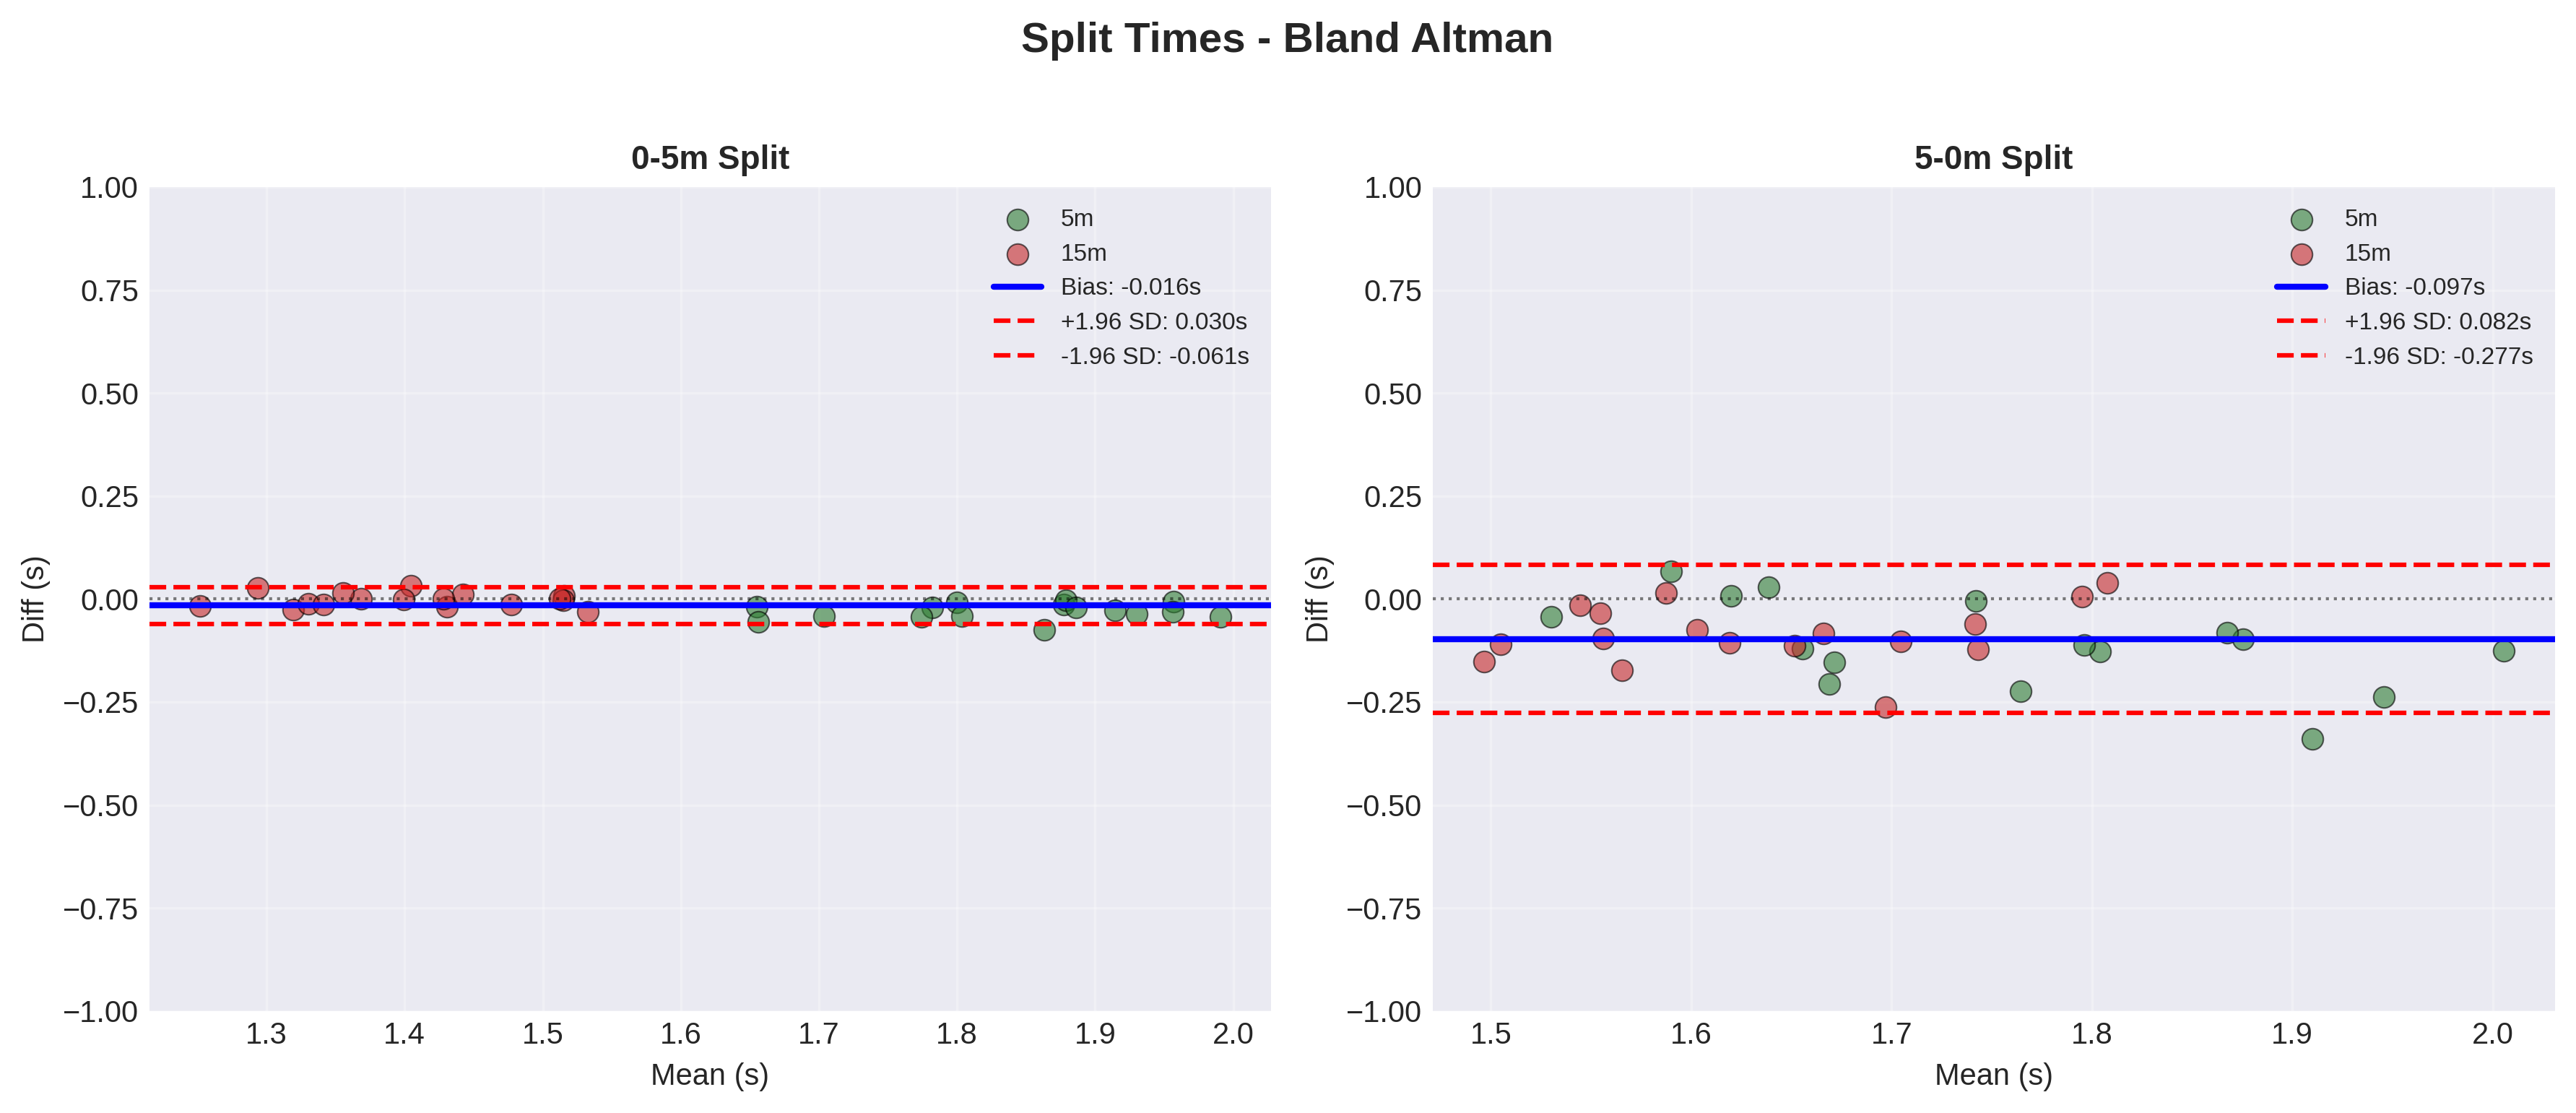
This looked like a problem, until we looked closer...
Qualisys references the sacrum marker — a point on the athlete's back, approximately 0.25 m posterior to the leading edge. Ledsreact Pro times when the leading edge crosses the finish line.
At a max re-acceleration velocity of ~3.1 m/s:
0.25m / 3.1 m/s ≈ 0.081 s (81 ms)
We observed a bias of 97 ms. The geometry explains ~84% of it.
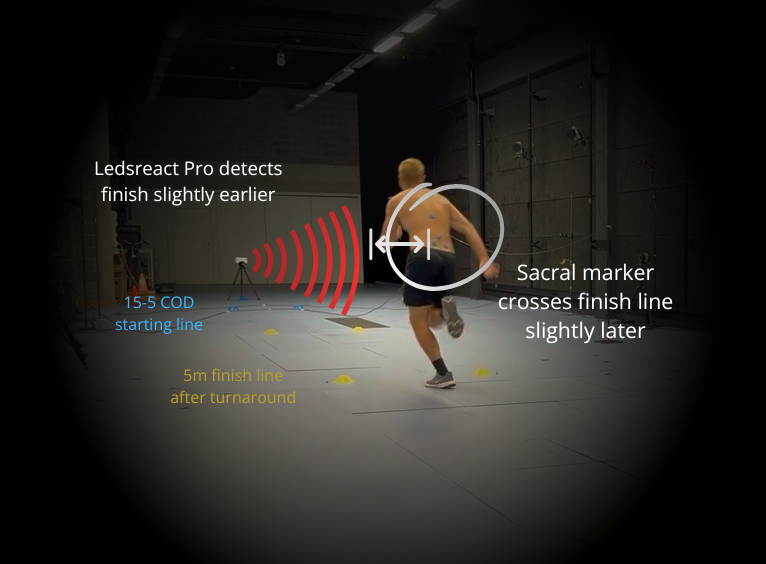
Both systems are measuring correctly—their reference points are just different.
For practical use, for within-device tracking, no correction is needed. For cross-system comparison, the offset is knowable and easily correctable if needed. It represents <6% of the return split time.
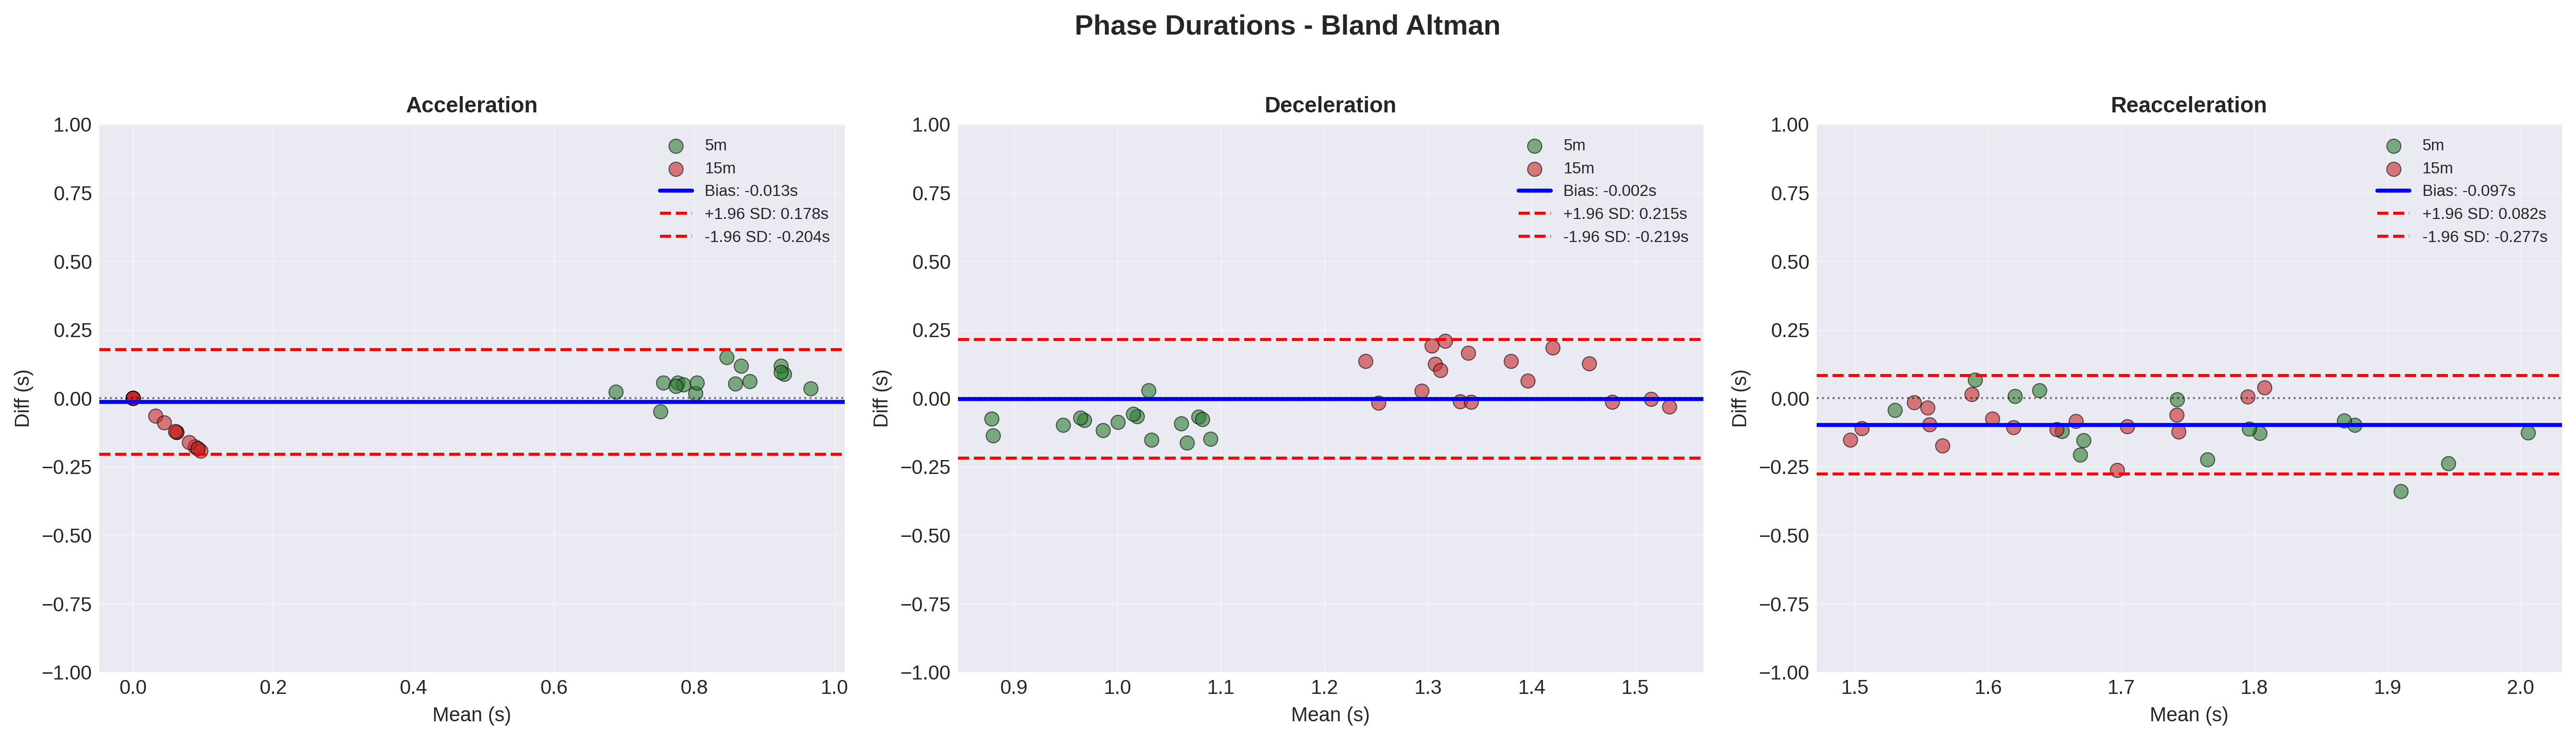
If we split our 5-0-5 in the following zones:
- Acceleration - Initial sprint from start to maximum velocity
- Deceleration - From maximum velocity to turnaround point (maximum distance)
- Reacceleration - From turnaround point back to finish
We notice excellent agreement for the acceleration and deceleration zones (signifying we detect peak velocity at about the same time), and the same bias effect for the return segment.
Velocity
The Ledsreact Pro has an accuracy advantage vs. other systems for measuring velocity, since we are measuring this directly through the Doppler effect, rather than taking the derivative of positional data.
Max velocity: Bias +0.0796 m·s⁻¹ (Pro reads ~1.6% higher); CCC 0.948
Average velocity: Bias +0.0344 m·s⁻¹; CCC 0.930
This bias and MAE of 0.09 m/s is in line with the results (MAE 0.20 m/s) from the 2023 Qualisys study at TU Dortmund.
Waveform Similarity (CMC): 0.975 ✓ Excellent
The Coefficient of Multiple Correlation (CMC) of 0.975 demonstrates excellent waveform similarity across all 33 trials. This exceptionally high CMC indicates that velocity curves from the Ledsreact Pro track nearly identically to Qualisys throughout the entire movement—not just at discrete points.
Velocity metrics are very strong across the entire movement. The small positive bias (Pro reading slightly higher) may reflect how the systems estimate center of mass during dynamic body deformations—radar senses the entire reflecting surface, motion capture tracks a single anatomical marker. But the agreement is tight enough for coaching decisions about entry speed, minimum speed at turn, and re-acceleration quality. The excellent CMC waveform matching means you can rely on the shape and timing of velocity curves for movement analysis and athlete profiling.
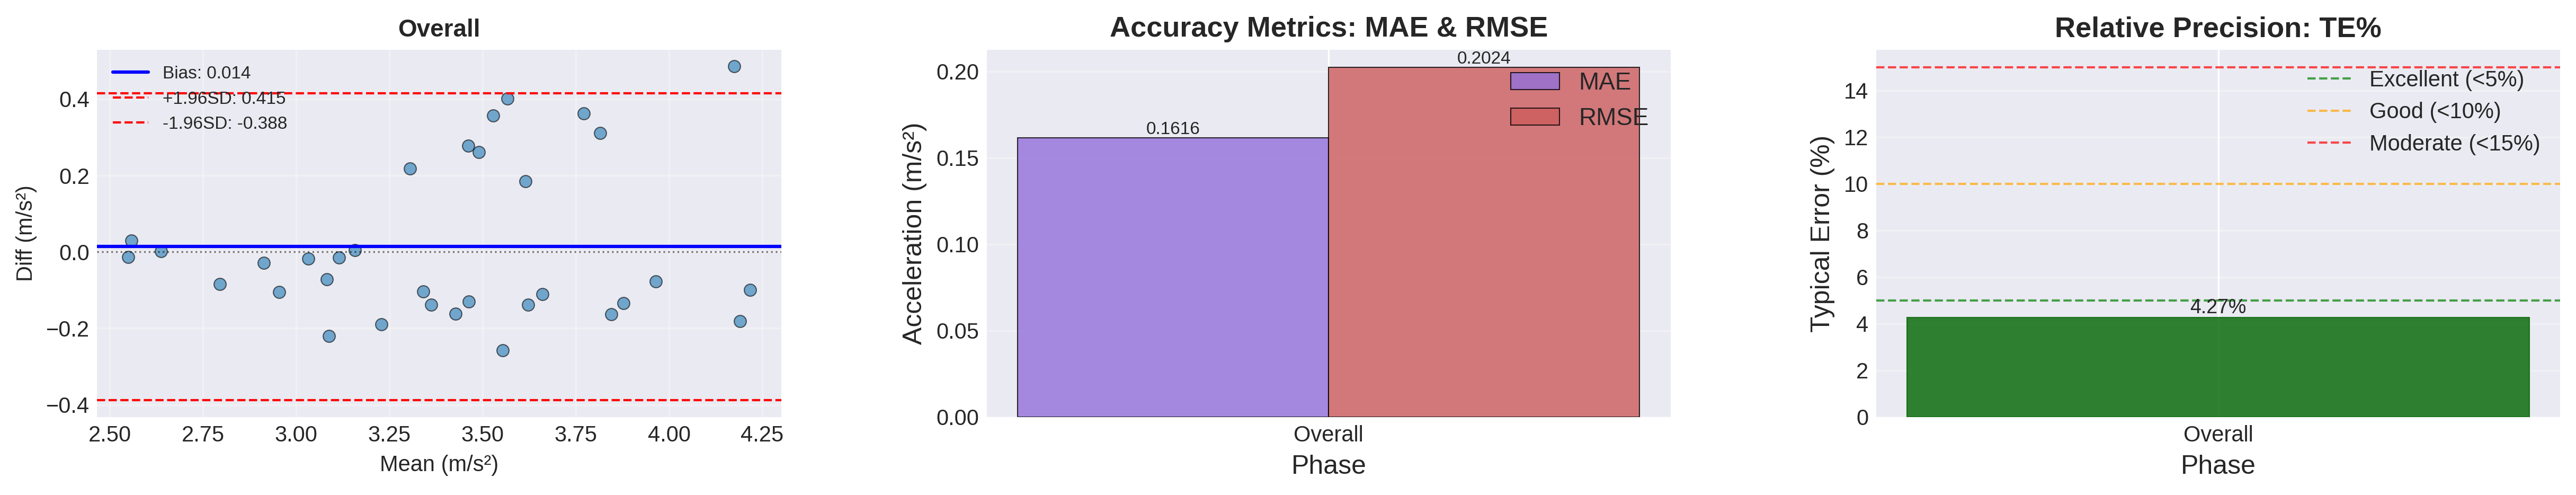
Acceleration
Average acceleration: Bias +0.0135 m·s⁻²; CCC 0.902 ✓ Strong
Peak acceleration: Bias +0.186 m·s⁻²; CCC 0.617 ⚠ Moderate
Waveform Similarity (CMC): 0.968 ✓ Excellent
The CMC of 0.968 reveals excellent waveform shape agreement despite the wider scatter seen in peak values. This paradox is expected: CMC measures how well the overall motion patterns align across trials, which is excellent; while individual peak acceleration varies naturally due to subtle changes in athlete technique and body positioning between trials.
For coaching use, rely on phase timing and average acceleration (overall, by split, per zone, and/or use ratio's); treat peak values with appropriate context (= comparison between trials captured with the Ledsreact is ok, but comparing with peak acceleration/deceleration values captured with another device is more tricky and not recommended at this point).
Limitations and Next Steps
Sample size of 33 trials executed by 3 participated running at variable speeds was low but intentional for controlled lab validation. Since this is a follow-up study, this was deemed sufficient for testing the core tracking in the new firmware version that was tested.
Lab conditions are different from field conditions: these tests were performed indoors, without reflective surfaces or other athletes in the detection zone, and participants ran the running trials shirtless to permit unobstructed marker placement for optimal tracking. However, the Ledsreact Pro has already been field-tested, in harsh conditions sometimes, by real customers in elite sports for more than 30,000 trials.
Acceleration sensitivity to filtering/segmentation remains. Peak values should be contextualized; averages are more robust. This study was limited to the smoothened acceleration curves.
Instantaneous acceleration and step/stride detection is still in R&D and to be followed up on.
Conclusions: What This Enables
Lab-grade COD performance metrics, anywhere, any time, in minutes.
For practitioners
- Measure COD with millisecond-level bias on total time and very strong velocity and acceleration/deceleration tracking.
- Three-minute setup, live scoreboards, and multiplayer keep testing fast and engaging.
- Run 505 assessments regularly for rapid assessments, profiling, and return-to-play: track entry speed, braking distance and peak decel, exit speed, plus simple indices like COD deficit and deceleration deficit to target training.
For researchers and sports data analysts
- The system is reliable, accurate, and precise for 505 change-of-direction performance and center-of-mass kinematics; ideal when COM-level data meets your needs.
- Use it to collect high-frequency velocity time-series in the field, complementing lab work, with transparent bias you can document and correct when cross-system comparison is required.
Acknowledgments
We thank the researchers at the Department of Movement and Sports Sciences at the University of Ghent (UGent) for collaboration, facility support, and their expertise in motion capture protocols and biomechanical analysis.
We would like to extend special thanks to Lennert Van der Meulen for his meticulous work in processing the Qualisys motion capture data, and to prof. dr. Veerle Segers for providing access to the biomechanics laboratory facility that made this validation study possible.
Interested in learning more? Contact us at support@ledsreact.com or book a demo.
Join the Discussion on Medium
We've also published this article on Medium. Join the conversation and leave your comments there to engage with our broader community.
Read & Comment on MediumNote: This article is originally published on ledsreact.com. The Medium version is a syndicated copy for wider distribution and community engagement.
Citations
Draper, J. A., & Lancaster, M. G. (1985). The 505 test: A test for agility in the horizontal plane. Australian Journal of Science and Medicine in Sport, 17(1), 15–18.
Ken-ichi, Kaneko, et al. "Factors affecting the 180-degree change-of-direction speed in youth male soccer players." Human Performance Measurement 16 (2019): 1-10.
Ledsreact. (2023). Validation with Qualisys: Process and results. https://ledsreact.zohodesk.eu/portal/en/kb/articles/validation-with-qualisys-process-and-results
Napier, C., Jiang, X., MacLean, C. L., Menon, C., & Hunt, M. A. (2020). The use of a single sacral marker method to approximate the centre of mass trajectory during treadmill running. Journal of Biomechanics, 108, 109886.